The core of all electronic devices lies in their power supply. Without it, functionality is impossible. Therefore, in order to stay competitive, manufacturers of power supplies must provide customers with assurance regarding the high quality of their products. Reliability stands out as a crucial indicator when describing product quality, and the rate at which products fail is commonly used to gauge their reliability.
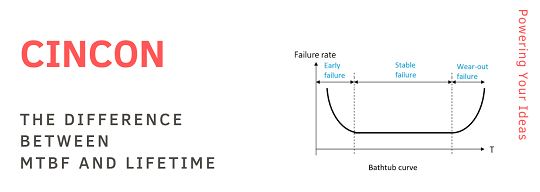
Over time, the functionality of goods tends to experience a decline. The failure rate of a product fluctuates throughout its lifespan, typically following a bathtub-like curve, especially applicable to the failure scenarios of electronic products. This curve can be roughly divided into three stages.
1. Early failure period
The initial stage is the early failure period, occurring at the outset of a product’s life. During this time, the product experiences a high failure rate, primarily due to manufacturing errors that may not have been detected during pre-shipping inspections. At CINCON, every power supply undergoes 100% inspection testing to ensure that each unit meets all specifications before being shipped, effectively eliminating early failures.
2. Stable failure period
The second stage is random or constant cause failure period. It’s also the normal design failure rate. This stage is assumed to be the period when the product will be in service. The failure rate for this period is expected to be low and flat. Thus remains almost constant.
3. Wear-out failure period
Lastly, if products remain in use for an extended period, the failure rate starts to rise as materials wear out, leading to degradation failures occurring at an increasing rate. The failure rate accelerates with time until all units ultimately fail.

Bathtub curve
MTBF
MTBF (Mean Time Between Failures) and lifetime are important parameters to be considered in product design phase. It can help locate problem areas by identifying overstressed parts or finding the higher contributor to failure. Also, they are key indicators for system engineers to choose a good power supply. Reliability engineers often utilize various methods and standards to calculate the MTBF value of products. There are several reliability prediction standards, such as MIL-HDBK-217F and Telcordia SR332 (Bellcore), etc. These two are currently the most popular reliability standards in the market and used in military and communication application respectively.
MIL-HDBK-217, is a widely used standard that consists of two calculation methods – one is known as Part Stress Analysis Prediction that is applicable during later design phases and the other is called Parts Count Reliability Prediction that is applicable during early design phase and during proposal formulation. For Part Stress Analysis Prediction, reliability is determined by summing the failure rate of each part up. The failure rate of each part is evaluated individually and is calculated by including the variables of ambient temperature, electrical stress level, base failure rate, power rating, operating environment factor, and part quality factor. The following simple equation is the formula for calculating the part failure rate, λp.

Taking a power module as an example, if its MTBF= 1000Khours (about 114 years), it does not mean that each module can work for 114 years without failure. From MTBF=1/λ, it can be seen that λ=1/MTBF=1/114 years, that is, the average failure rate of this power module is about 0.88%/year. In other words, 8.8 units of 1000 PCS will fail per year on average.
Lifetime
In the context of an AC/DC power supply, a crucial component is the internal aluminum electrolytic capacitor. However, this capacitor stands out as the component with the shortest lifespan due to its inherent limitations and progressive deterioration over time. Consequently, the aluminum electrolytic capacitor holds paramount importance in terms of the overall reliability of the power supply. Estimating the expected lifetime of power supplies becomes possible by evaluating the anticipated lifespan of this capacitor.
The longevity of a capacitor is contingent on various application-specific factors, with a pivotal one being the operating temperature. This factor plays a significant role in causing internal structures to age and the electrical properties to degrade over time. In the case of liquid electrolytic capacitors, doubling the expected lifetime is achievable by reducing the component’s temperature by 10 °C. For polymer capacitors, a tenfold increase in lifespan is attainable with a 20 °C reduction in temperature at the component. The formulas for estimating the lifetime are as follows:

How does MTBF differ from the life cycle?
According to the information provided earlier, the primary distinction lies in one encompassing the failure rate of all components, while the other exclusively focuses on the lifespan of electrolytic capacitors. Additionally, it’s noteworthy that MTBF calculations employ various methods. Despite these differences, both MTBF and the life cycle are vital parameters for engineers to assess the reliability of a product.
For more information contact us — office@vitecpower.com